


np-chart
| np-chart | |
|---|---|
| Originally proposed by | Walter A. Shewhart |
| Process observations | |
| Rational subgroup size | n > 1 |
| Measurement type | Number nonconforming per unit |
| Quality characteristic type | Attributes data |
| Underlying distribution | Binomial distribution |
| Performance | |
| Size of shift to detect | ≥ 1.5σ |
| Process variation chart | |
| Not applicable | |
| Process mean chart | |
 | |
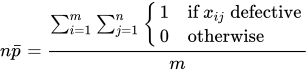
| Center line | |
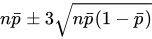
| Control limits | |
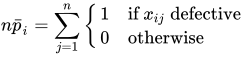
| Plotted statistic | |
In statistical quality control, the np-chart is a type of control chart used to monitor the number of nonconforming units in a sample. It is an adaptation of the p-chart and used in situations where personnel find it easier to interpret process performance in terms of concrete numbers of units rather than the somewhat more abstract proportion.[1]
The np-chart differs from the p-chart in only the three following aspects:
- The control limits are , where n is the sample size and is the estimate of the long-term process mean established during control-chart setup.
- The number nonconforming (np), rather than the fraction nonconforming (p), is plotted against the control limits.
- The sample size, , is constant.


See also
[edit]References
[edit]- ↑ Montgomery, Douglas (2005). Introduction to Statistical Quality Control. Hoboken, New Jersey: John Wiley & Sons, Inc. p. 279. ISBN 978-0-471-65631-9. OCLC 56729567. Archived from the original on 2008-06-20.