


Talk:Gallagher index
Add topic | This article is rated C-class on Wikipedia's content assessment scale. It is of interest to the following WikiProjects: | |||||||||||||||||||||||||||
| ||||||||||||||||||||||||||||


"The index weighs the deviations by their own value"
[edit]I think the above statement in the article is false. Since the index is based on least squares, my interpretation is that it weighs the deviations by the square of their own value. Weights by their own value would be akin to least absolute deviations. Can someone else confirm my logic here? Am I missing something? Thanks! -PatrickButton (talk) 06:25, 11 May 2012 (UTC)
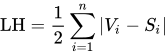
- Even if this comment is six years old, I thought it deserved a response. The article is correct in stating that the deviations are weighted by their own value, because each deviation is multiplied (weighted) by itself. If we instead weight all (absolute) deviations equally, i.e. weight them all by 1, we get the Loosemore–Hanby index: . Thomas Nygreen (talk) 17:09, 15 May 2018 (UTC)
Accuracy of the Table
[edit]I'm not certain of the accuracy of the table. I tried to calculate the Index for the UK 2005 General Election on Edexcel, and came up with 16.8
This was worked out as follows (although I used many smaller parties in order to improve accuracy, these will have comparitively little impact and so I have not listed them, and have rounded the numbers greatly – should it become apparent that I am correct, and have not made some mistake, I shall write the calculation more fully): Labour has 35% of the vote and 55% of the seats. This is a difference of about -20, which squares to 400.
Conservative has 32% of the vote and 30% of the seats. This is a difference of about 2, which squares to 4.
Liberal Democrats have 22% of vote and 10% of seats. This is a difference of about 12, which squares to 144.
The sum of these three is 548. Half of this is 274. The root of this is 16.6 (and would be 16.8 had I not rounded, and had I listed all parties involved) comment by user:Ronald Collinson Sept 25/05
- Hi, there! Just as a quick first note, it's helpful to sign your talk page contributions, especially on more heavily used talk pages. Just type four tilde signs (~~~~) and an automagic date, time and signature stamp will appear.
- I suppose my first question is whether you've misread the table; you calculate a rough value for the 2005 UK election as 16.6%, and seem to consider it close enough to 16.8% (your 'unrounded' value), but the table gives the value as 16.9%, which is certainly close as well - are you perhaps looking at the 18.0% score from the 2001 election? Alternately, is it simply that you're dealing with the percents as whole numbers, rather than as decimals, which is the common method used in engineering and science? Taking Labour as an example, they have 0.35 of the vote, and 0.55 of the seats (also commonly written as 35% and 55%). The difference would be -0.2, squaring to 0.04. In other words, 0.169 = 16.9%.
- As far as the specific values, they do depend on rounding and the list of parties; if all parties in this election that failed to win seats were combined as a single monolithic "others" category, a score of 0.169362 results. Taking all parties singly, I get 0.166868, rounded to 0.167. The exact value seems to be dependent on this rounding; the point of the Gallagher Index is, in my opinion, not in quibbling over 0.166 versus 0.169 versus somewhere in between, but much more to enable us to say that the 2005 UK election was more representative than the previous one, but was much less representative than those in, say, the Netherlands or Germany.
- Anyways, in view of the fact that we seem to be agreeing (that the proper result for that election is somewhere around 0.168), I'll edit the main page, to both remove the dispute tag and update the 2005 election result to the value of 0.167, which is closer to your calculations than to my original result, and seems to be better, in that it includes all parties, assuming the current table on the election results page is, in fact, correct.ByeByeBaby 05:36, 26 September 2005 (UTC)
Ronald Collinson 20:40, 26 September 2005 (UTC)
- Ah, clearly my mistake was indeed to deal with the percents as whole numbers. Thanks for clearing that up.
hang on, you are meant to use the percentages as whole numbers. Check Arjend Lijphart's 1994 book to see it in action. The UK should be around 16 percent, as that indicates that it's system is 16% disproportional. Redo the table. It is currently incorrect.--LeftyG 01:10, 16 October 2005 (UTC)
I've created an example of how to calculate proportionality in place of the previous table which was clearly wrong. Hopefully someone can redo the old table so that it is actually correct. NB: NZ had a very proportional election and thus the figure is low. Most FPP elections (such as the UKs) will be somewhere btwn 10 and 20% disproportional.
The table needs a bit of clean up at some point of time, but my feeling is not many people actually look at this page.--LeftyG 04:22, 2 January 2006 (UTC)
Also, can people please calculate for elections the disproportionality? That way, we could ultimately have a wiki-list of the most proportional countries. --LeftyG 04:31, 2 January 2006 (UTC)
Formula
[edit]The current formula for the index is
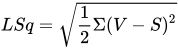
this is not the standard least squares formula which is either
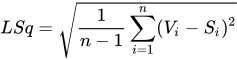
In a sense this calculates the average of the squrard differences. Using this formula will require the totals in the table to be recalculated. --Salix alba (talk) 13:32, 13 March 2006 (UTC)
- what exactly does the n mean? Would it make a difference that both votes and seats need to add to 100%? Cheers for this check though. --Midnighttonight 03:59, 30 March 2006 (UTC)
n is the number of parties. For most situations your wish to find the average deviation from expectation, see Root mean square. How you choose the divisor can affect the results, leading to some bias, when trying to compare elections with different numbers of parties, say 3 as opposed to 4. There is some justification for using 2 parties as the first two parties tend to get the most votes, with 10 parties dividing by n-1 would over correct. Hence I'm not sure what Gallagher actually intended. From a statistical POV the Sainte-Laguë Index is a better measure. --Salix alba (talk) 07:59, 30 March 2006 (UTC)
I just got a reply from the man himself, seem like it should be 2.
- Thanks for your message. I can confirm that the demoninator is 2; the index measures total disproportionality per election, not disproportionality per unit (eg party), so it would not make sense to divide by the number of units. Division by 2 ensures that the value of the index ranges between 0 and 100.
- I took a look at the wikipedia address and the article makes good sense to me. Under 'References', you could add the following, which fleshes out the index somewhat and refines the calculation of it:
- Michael Gallagher and Paul Mitchell (eds), The Politics of Electoral Systems (Oxford: Oxford University Press, 2005), Appendix B. (http://www.oup.co.uk/isbn/0-19-925756-6)
- Sorry to say I don't have the 1991 paper in electronic form. Best wishes Michael Gallagher
--Salix alba (talk) 23:35, 3 April 2006 (UTC)
- Thank you for that Salix, and thanks to Michael as well. It is good to know Wikipedia can be trusted now and then by academics. --Midnighttonight 07:37, 4 April 2006 (UTC)
Fascinating page
[edit]Thanks for this information. I knocked up an index for the Australian federal election, 2007 located here, and note that the example gives a low rating, with the article stating the result ranges 0-100. The one I knocked up gives a rating of 10.28 - ok, it's low in terms of 100, but high in terms of the example. Google doesnt seem to show up much for the index, can anyone point me toward some sort of list of ratings so I know what sort of context to put that result in? Thanks. Timeshift (talk) 13:07, 9 May 2008 (UTC)

- If you’re still looking for this, anything over 10 is generally seen as too disproportionate. (One proposal to amendment for the Greek constitution wanted to limit electoral systems to those that “do not exceed a Gallagher index of 10” this amendment didn’t happen, but it’s a guideline)
- I would personally say the index has to stay below 5 in order for it to be considered a functional proportionally representative system. (The Canadian question mentioned in this article also mentions electoral reform towards a system that would limit itself to a Gallagher index to 5)
- It’s very much a subjective question, but comparison with official policy (maybe the EU has some guidelines?) and the index result for countries or legislatures using systems that are already considered “proportional”.
- If your goal is to pass some sort of judgement on an election or a system, I would also suggest looking at other indices and how they work and what kind of (dis)proportionality they focus on and what you, making your judgement, think is important. Several of these are mentioned in this article already and you can simply go to their pages, which are linked.
- I don’t have an account yet, so I don’t have anything to sign this comment with. 86.92.89.111 (talk) 15:05, 30 October 2024 (UTC)
Condensing non-parliamentary parties
[edit]Is there any meaning to a Gallagher calculation where you collapse all non-parliamentary parties into one grouping? The number will certainly be different from the painstakingly compiled one for the same reason that 22 + 32 equals 13 rather than 25, but is it actually inaccurate or just imprecise to do it the lazy way? -Rrius (talk) 07:00, 16 February 2010 (UTC)
- I assume you mean you’ll count all the votes for parties or candidates which did not receive representation as one “party” to compare to their number of seats (by definition 0). I believe this is mentioned in the article, although I’m not sure what Gallagher himself meant by “other parties”. Doing this, as opposed to counting those parties all separately, would *significantly* increase your result. (0.1^2 +0.2^2 < 0.3^2 obviously, and all those values would be positive, and thus increase the sum, since the number of seats would always be 0. This is especially strong if it manages to push the number above 1) 86.92.89.111 (talk) 15:12, 30 October 2024 (UTC)
"Citation needed" and "Original Research?":
[edit]Hi! I'm from Germany and I have no experience in editing english Wiki-Pages. So I can give you facts to insert:
1) The needed citation for the current formula is:
Gallagher, Michael (1991): Proportionality, Disproportionality and Electoral Systems, in: Electoral Studies (10), p.40
Original text: "A least squares index would entail squaring the vote-seat difference for each party; adding these values; dividing the sum by 2; and taking its square root"
2) There is an indicator named "Original research?" near this text in the wiki-article "Unlike the well-known Loosemore–Hanby index, the Gallagher index is less sensitive to small discrepancies"
There is a note from gallagher in his original article:
"The least squares index can be seen as a happy medium between the Loosemore-Hanby and Rae indices" (same article, p.41). The loosemore-hanby index is more sensitive as the gallagher index, the rae index is more insensitive comparing with the gallagher index.
So you can see that I'm not able to edit the article....but you can use these informations to modify it correctly. —Preceding unsigned comment added by Don Politicus (talk • contribs) 21:17, 27 November 2010 (UTC)
- Thanks! Only took three years for somebody to work your contributions in. Schwede66 20:54, 9 August 2013 (UTC)
Benchmarking
[edit]Does anyone have some statistics showing Gallagher indices internationally, say for recent elections in G7 countries? — Sasuke Sarutobi (talk) 10:32, 16 June 2017 (UTC)
Canada section
[edit]The data should ideally be in a table rather than an image. Crookesmoor (talk) 13:42, 25 January 2018 (UTC)
Relation to method of least squares
[edit]I have rewritten parts of the second paragraph of the introduction to better reflect the relation between the Gallagher index and the method of least squares. The article previously claimed that "the Gallagher index uses the method of Least squares". It does not. The method of least squares involves finding an approximate solution to an overdetermined system of equations that minimises the sum of squared residuals (SSR), e.g. fitting a trend curve to a data set. The Gallagher index simply calculates the (root of half of) the SSR of a given fit, which rarely is optimal. Thomas Nygreen (talk) 17:54, 15 May 2018 (UTC)
Sweden 2018
[edit]The Sweden 2018 example is seriously flawed in two ways:
- All parties that did not gain representation are aggregated in a single group, "Others". Gallagher writes "In the calculation of indices, the greater the amount of disaggregation in the data, the better. Ideally, every party winning more than 0.1 per cent of the national vote, certainly 0.5 per cent, should be listed separately." There is no reason not to split the results like this for Sweden. Part of the problem might be that the table seems to use the preliminary election night results rather than the final results from a week later.
- Even so, the "Others" group is inflated to 2.5%, whereas the true figure lies around 1.5% of the valid votes (0.46% for FI and 1.07% for other parties).
Together, these flaws create an entirely made-up Gallagher index, which says nothing of the election itself. In fact, the Gallagher index of this particular election was very low, as might be expected from an Sainte-Laguë election. (It is quite possible for a Swedish election to have a Gallagher index of 1.8 or indeed much higher, but then it has nothing to do with Sainte-Laguë per se, but with an artificial 4% cutoff. See the 2006 Riksdag election for a good example.) A truer count as follows (which may count as original research). The 588 votes for parties with only hand-written ballots are still grouped, but they hardly affect the result:
| Abbr | Party | Votes | Votes % | Seats | Seats % | S% - V% | (S% - V%)² |
|---|---|---|---|---|---|---|---|
| S | Arbetarepartiet-Socialdemokraterna | 1830386 | 28.2609806653826 | 100 | 28.6532951289398 | 0.392314463557245 | 0.153910638316209 |
| M | Moderaterna | 1284698 | 19.835611362224 | 70 | 20.0573065902579 | 0.221695228033916 | 0.0491487741330099 |
| SD | Sverigedemokraterna | 1135627 | 17.533969714632 | 62 | 17.7650429799427 | 0.231073265310684 | 0.0533948539413417 |
| C | Centerpartiet | 557500 | 8.60774542689399 | 31 | 8.88252148997135 | 0.274776063077352 | 0.0755018848402891 |
| V | Vänsterpartiet | 518454 | 8.00487900906708 | 28 | 8.02292263610315 | 0.0180436270360698 | 0.000325572476616788 |
| KD | Kristdemokraterna | 409478 | 6.3223002366165 | 22 | 6.30372492836676 | -0.018575308249738 | 0.000345042076572783 |
| L | Liberalerna (tidigare Folkpartiet) | 355546 | 5.48959543596494 | 20 | 5.73065902578797 | 0.24106358982303 | 0.0581116543383661 |
| MP | Miljöpartiet de gröna | 285899 | 4.41425257363868 | 16 | 4.58452722063037 | 0.170274646991689 | 0.0289934554081442 |
| FI | Feministiskt initiativ | 29665 | 0.458024696123427 | 0 | -0.458024696123427 | 0.209786622258957 | |
| AfS | Alternativ för Sverige | 20290 | 0.313275613832608 | 0 | -0.313275613832608 | 0.0981416102221975 | |
| MED | Medborgerlig Samling | 13056 | 0.201583361961485 | 0 | -0.201583361961485 | 0.0406358518196951 | |
| PP | Piratpartiet | 7326 | 0.113112722865337 | 0 | -0.113112722865337 | 0.0127944880740105 | |
| DD | Direktdemokraterna | 5153 | 0.0795618155780892 | 0 | -0.0795618155780892 | 0.00633008249808188 | |
| LPo | Landsbygdspartiet Oberoende | 4962 | 0.0766127942748843 | 0 | -0.0766127942748843 | 0.00586952024660574 | |
| ENH | Enhet | 4647 | 0.0717492251099128 | 0 | -0.0717492251099128 | 0.00514795130387294 | |
| DjuP | Djurens parti | 3648 | 0.0563247629010032 | 0 | -0.0563247629010032 | 0.00317247891585423 | |
| KrVP | Kristna Värdepartiet | 3202 | 0.049438566559488 | 0 | -0.049438566559488 | 0.00244417186345693 | |
| NMR | Nordiska motståndsrörelsen | 2106 | 0.0325164338458094 | 0 | -0.0325164338458094 | 0.0010573184700489 | |
| KLP | Klassiskt liberala partiet | 1504 | 0.023221612774975 | 0 | -0.023221612774975 | 0.000539243299870882 | |
| SKP | Sveriges Kommunistiska Parti (SKP) | 702 | 0.0108388112819365 | 0 | -0.0108388112819365 | 0.000117479830005433 | |
| Basinkomstpartiet | 632 | 0.00975801813416503 | 0 | -0.00975801813416503 | 0.0000952189179066936 | ||
| Initiativet | 615 | 0.00949553979827768 | 0 | -0.00949553979827768 | 0.0000901652760606753 | ||
| TRP | TRYGGHETSPARTIET | 511 | 0.00788978997873153 | 0 | -0.00788978997873153 | 0.0000622487859084925 | |
| SKÅ | SKÅNEPARTIET | 296 | 0.0045702110248621 | 0 | -0.0045702110248621 | 0.0000208868288117711 | |
| Norrlandspartiet | 60 | 0.000926394126661237 | 0 | -0.000926394126661237 | 0.000000858206077912436 | ||
| Sverige ut ur EU/Frihetliga Rättvisepartiet (FRP) | 53 | 0.000818314811884093 | 0 | -0.000818314811884093 | 0.000000669639131348898 | ||
| EAP | Europeiska Arbetarpartiet-EAP | 52 | 0.000802874909773072 | 0 | -0.000802874909773072 | 0.000000644608120743119 | |
| NY REFORM | 32 | 0.00049407686755266 | 0 | -0.00049407686755266 | 0.000000244111951050648 | ||
| CSIS | Common sense in Sweden | 21 | 0.000324237944331433 | 0 | -0.000324237944331433 | 0.000000105130244544273 | |
| Vårt land - Sverige | 9 | 0.000138959118999186 | 0 | -0.000138959118999186 | 0.0000000193096367530298 | ||
| RNP | Reformist Neutral Partiet | 4 | 0.0000617596084440825 | 0 | -0.0000617596084440825 | 0.00000000381424923516638 | |
| Folkhemmet Sverige | 2 | 0.0000308798042220412 | 0 | -0.0000308798042220412 | 0.000000000953562308791595 | ||
| Gup | Gula Partiet | 1 | 0.0000154399021110206 | 0 | -0.0000154399021110206 | 0.000000000238390577197899 | |
| Votes for parties with only hand-written ballots | 588 | 0.00907866244128012 | 0 | -0.00907866244128012 | 0.0000824221117227104 | ||
| Valid votes | 6476725 | 100 | 349 | 100 | 0.806122182264982 | ||
| sum/2 | 0.403061091132491 | ||||||
| sqrt(sum/2) | 0.634870924781164 |
Different things to be proportional to
[edit]The article contains some of the confusion that many discussions about proportional representation have. There are two very different things a system can be proportional to:
1) Votes for candidates, to ensure that each voter has a representative and each representative represents approximately the same number of voters. 2) Votes for parties, where the makeup of parliament is proportional along party lines.
The second criteria presumes that a vote for a party nominated candidate is an endorsement of the party and all of its candidates, and a rejection of all other candidates from any other party. I, and many other electoral reformers, consider this discriminatory to voters who don't consider party affiliation to be the only demographic trait of importance. My experience has been that there are good and bad candidates nominated by each party, and this second form of proportionality demands I strategically vote based on whether the good outweighs the bad.
The Gallagher index is a method to determine proximity to a pure party list system, and thus is only a measure of party proportionality.
The opening "measures an electoral system’s relative disproportionality between votes received and seats allotted in a legislature." is the result of extensive lobbying in the Canadian context to suggest that the second type of proportionality is the only type of proportionality possible. This lead to an opposition to ranked ballots in Canada (including in multi-member districts), and a counterproductive suggestion that even STV needed "top-up seats" to make it "fair" (according to the criteria set out for the second type of proportionality, which people supporting the first criteria like myself consider discriminatory).
Even though Michael Gallagher was a witness to the Canadian parliamentary committee, he was not asked to clarify what his index was used for. He was there to talk about ranked ballots in multi-member districts which is a system which is proportional according to the first type of proportionality. — Preceding unsigned comment added by Russell McOrmond (talk • contribs) 13:04, 30 October 2019 (UTC)
- STV is not a good example of proportional representation. It enjoys mathematical paradoxes like a 'no-show winner' and IMHO should not be used for anything, because it tends to higher scores on the index without convoluted corrections being applied. The strategic voting you mention would also occur in elected dictatorships, it is not solely a property of proportional representation systems. A system proportional to electorates, as in your example #1 has inherent risk of gerrymandering, and exacerbates the problems of focused campaigning in the Cambridge Analytica style. It is difficult to see #1 as anything other than a poorly-veiled attempt at regression away from proportional representation - of any kind. Only parties can offer the numbers required for a clean modulo operation. You simply can't split an individual up and achieve the same proportionality as you can with list systems. #1 is a thoroughly broken idea. WinstonSmith01984 (talk) 13:06, 12 March 2020 (UTC)
- Cristiano Toàn (talk) 08:13, 12 July 2024 (UTC) I argee with you, sometimes countries use first past the post electoral system might have very low Gallagher index like Jamaica 2016
Revert discussion
[edit]@Aficionado538, could you explain why you reverted my edit? As far as I can tell, the value was off. Slomo666 (talk) 13:55, 6 March 2026 (UTC)
- Hi, thanks for reaching out. The value is included in the reference attached to the Gallagher Index by country table. Aficionado538 (talk) 13:58, 6 March 2026 (UTC)
- Ok so
- 1 the source still says it is from 2024 July, (access and archive date) when in reality you’re referring to the updated version anno 2025. That was not clear to me when I was looking at the values. I thought there was no source bc there would be no way for a source dated July 2024 to include the 2024 elections in November.
- 2 Then I am *very* confused what happened here. I read his notes (on the difficulties with getting accurate data) in the new version of the document, and while he mentions the issues for the U.S. with results, especially with “other parties” including invalid votes, but even if I exclude those votes entirely from the count, I cannot get to the figure published here. I would still get to at least 1.7588.
- 3 my point wrt the electoral college stands in my opinion. This requires clarification, since this isn’t a directly elected body at all and it (to me at least) wasn’t entirely clear if the table shows the disproportionality of the distribution of votes to states or of votes to candidates (compared to popular vote) or some other issue.
- Thanks for your reply. Happy editing,
- PS: if you want I can show how I did my calculation(s), but as far as I can tell I followed the same procedure used in the paper.
- Slomo666 (talk) 17:50, 6 March 2026 (UTC)
- The table shows the Gallagher index for national lower houses. So the 1.01 refers to the House of Representatives, not the Electoral College (which Gallagher has as 7.29), unless I am misunderstanding your third point. For my part, I got a final result of 2.14, which does differ from his 1.01. I assume the values in the table are meant to be sourced, so I am wondering how this issue can be corrected, since your newly calculated value, even if correct, would still need a citation. But yes, I do see the problem.
- Again, please correct me if I have misunderstood your point. Aficionado538 (talk) 20:27, 6 March 2026 (UTC)
- Yeah we have a misunderstanding. The table includes both House of Representatives and Electoral college. The latter is not a lower house and my point about it is restricted to the lack of clarification, whereas my issue with the HoR value was that I cannot see how it can possibly be correct.
- We are, of course, supposed to follow the sources, I would never suggest we use OR, but I am concerned with the status quo, since we can clearly see there is something wrong/off about this, but we cannot correct the value unless we have another publication that is somehow more reliable. If this was academia, I would just reach out to the author. Slomo666 (talk) 20:51, 6 March 2026 (UTC)
- Yeah, I think the best way to resolve this is to send an email to Gallagher… Aficionado538 (talk) 15:39, 8 March 2026 (UTC)