


PRESS statistic

In statistics, the predicted residual error sum of squares (PRESS) is a form of cross-validation used in regression analysis to provide a summary measure of the fit of a model to a sample of observations that were not themselves used to estimate the model. It is calculated as the sum of squares of the prediction residuals for those observations.[1][2][3] Specifically, the PRESS statistic is an exhaustive form of cross-validation, as it tests all the possible ways that the original data can be divided into a training and a validation set.
Procedure
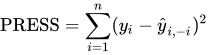
[edit]Instead of fitting only one model on all data, leave-one-out cross-validation is used to fit N models (on N observations) where for each model one data point is left out from the training set. The out-of-sample predicted value is calculated for the omitted observation in each case, and the PRESS statistic is calculated as the sum of the squares of all the resulting prediction errors:[4]
Usage
[edit]Given this procedure, the PRESS statistic can be calculated for a number of candidate model structures for the same dataset, with the lowest values of PRESS indicating the best structures. Models that are over-parameterised (over-fitted) would tend to give small residuals for observations included in the model-fitting but large residuals for observations that are excluded. The PRESS statistic has been extensively used in lazy learning and locally linear learning to speed-up the assessment and the selection of the neighbourhood size.[5][6]
See also
[edit]References
[edit]- ↑ "Statsoft Electronic Statistics Textbook - Statistics Glossary". Archived from the original on May 10, 2016. Retrieved May 13, 2016.
- ↑ Allen, D. M. (1974), "The Relationship Between Variable Selection and Data Augmentation and a Method for Prediction," Technometrics, 16, 125–127
- ↑ Tarpey, Thaddeus (2000) "A Note on the Prediction Sum of Squares Statistic for Restricted Least Squares", The American Statistician, Vol. 54, No. 2, May, pp. 116–118
- ↑ "R Graphical Manual:Allen's PRESS (Prediction Sum-Of-Squares) statistic, aka P-square". Archived from the original on February 27, 2018. Retrieved February 27, 2018.
- ↑ Atkeson, Christopher G.; Moore, Andrew W.; Schaal, Stefan (1 February 1997). "Locally Weighted Learning". Artificial Intelligence Review. 11 (1): 11–73. doi:10.1023/A:1006559212014. ISSN 1573-7462. S2CID 9219592. Archived from the original on 6 May 2021. Retrieved 25 September 2020.
- ↑ Bontempi, Gianluca; Birattari, Mauro; Bersini, Hugues (1 January 1999). "Lazy learning for local modelling and control design". International Journal of Control. 72 (7–8): 643–658. doi:10.1080/002071799220830.
 | This statistics-related article is a stub. You can help Wikipedia by adding missing information. |