


Gingerbreadman map

![{\displaystyle Q^{2},[-10..10,-10..10]}](https://wikimedia.org/api/rest_v1/media/math/render/svg/70019a033cca0fa15cbddb3e26054b209026cbb6)
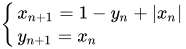
In dynamical systems theory, the Gingerbreadman map is a chaotic two-dimensional map. It is given by the piecewise linear transformation:[1]

See also
[edit]References
[edit]- ↑ Devaney, Robert L. (1988), "Fractal patterns arising in chaotic dynamical systems", in Peitgen, Heinz-Otto; Saupe, Dietmar (eds.), The Science of Fractal Images, Springer-Verlag, pp. 137–168, doi:10.1007/978-1-4612-3784-6_3. See in particular Fig. 3.3.
External links
[edit]

 | This fractal–related article is a stub. You can help Wikipedia by adding missing information. |