


// Workers AI · dad joke modeWhat did the cobweb plot say? It was a tangled story.



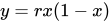

In mathematics, specifically dynamical systems, a cobweb plot, known also as Lémeray diagram or Verhulst diagram, is a visual tool used to investigate the qualitative behaviour of one-dimensional iterated functions, such as the logistic map. The technique was introduced in 1822 by Adrien-Marie Legendre.[1] Using a cobweb plot, it is possible to infer the long-term status of an initial condition under repeated application of a map.[2]
Method
[edit]For a given iterated function , the plot consists of a diagonal () line and a curve representing . To plot the behaviour of a value , apply the following steps.


- Find the point on the function curve with an -coordinate of . This has the coordinates ().
- Plot horizontally across from this point to the diagonal line. This has the coordinates ().
- Plot vertically from the point on the diagonal to the function curve. This has the coordinates ().
- Repeat from step 2 as required.



Interpretation
[edit]On a cobweb plot, a stable fixed point corresponds to the segment of the staircase with progressively decreasing stair lengths or to an inward spiral, while an unstable fixed point is the segment of the staircase with growing stairs or an outward spiral. It follows from the definition of a fixed point that the staircases converge whereas spirals center at a point where the diagonal line crosses the function graph. A period-2 orbit is represented by a rectangle, while greater period cycles produce further, more complex closed loops. A chaotic orbit would show a "filled-out" area, indicating an infinite number of non-repeating values.[2]

See also
[edit]- Jones diagram – similar plotting technique
- Fixed-point iteration – iterative algorithm to find fixed points (produces a cobweb plot)
Notes
[edit]- ↑ Rosa (2021).
- 1 2 Stoop & Steeb (2006), p. 8.
References
[edit]- Rosa, Alessandro (2021). "An episodic history of the staircased iteration diagram". Antiquitates Mathematicae. 15: 3–90. doi:10.14708/am.v15i1.7056.
- Stoop, Ruedi; Steeb, Willi-Hans (2006). Berechenbares Chaos in dynamischen Systemen [Computable Chaos in Dynamical Systems] (in German). Basel: Birkhäuser. ISBN 978-3-7643-7550-8.

 | This applied mathematics–related article is a stub. You can help Wikipedia by adding missing information. |